Vgrid
Vgrid - A unified framework for working with DGGS
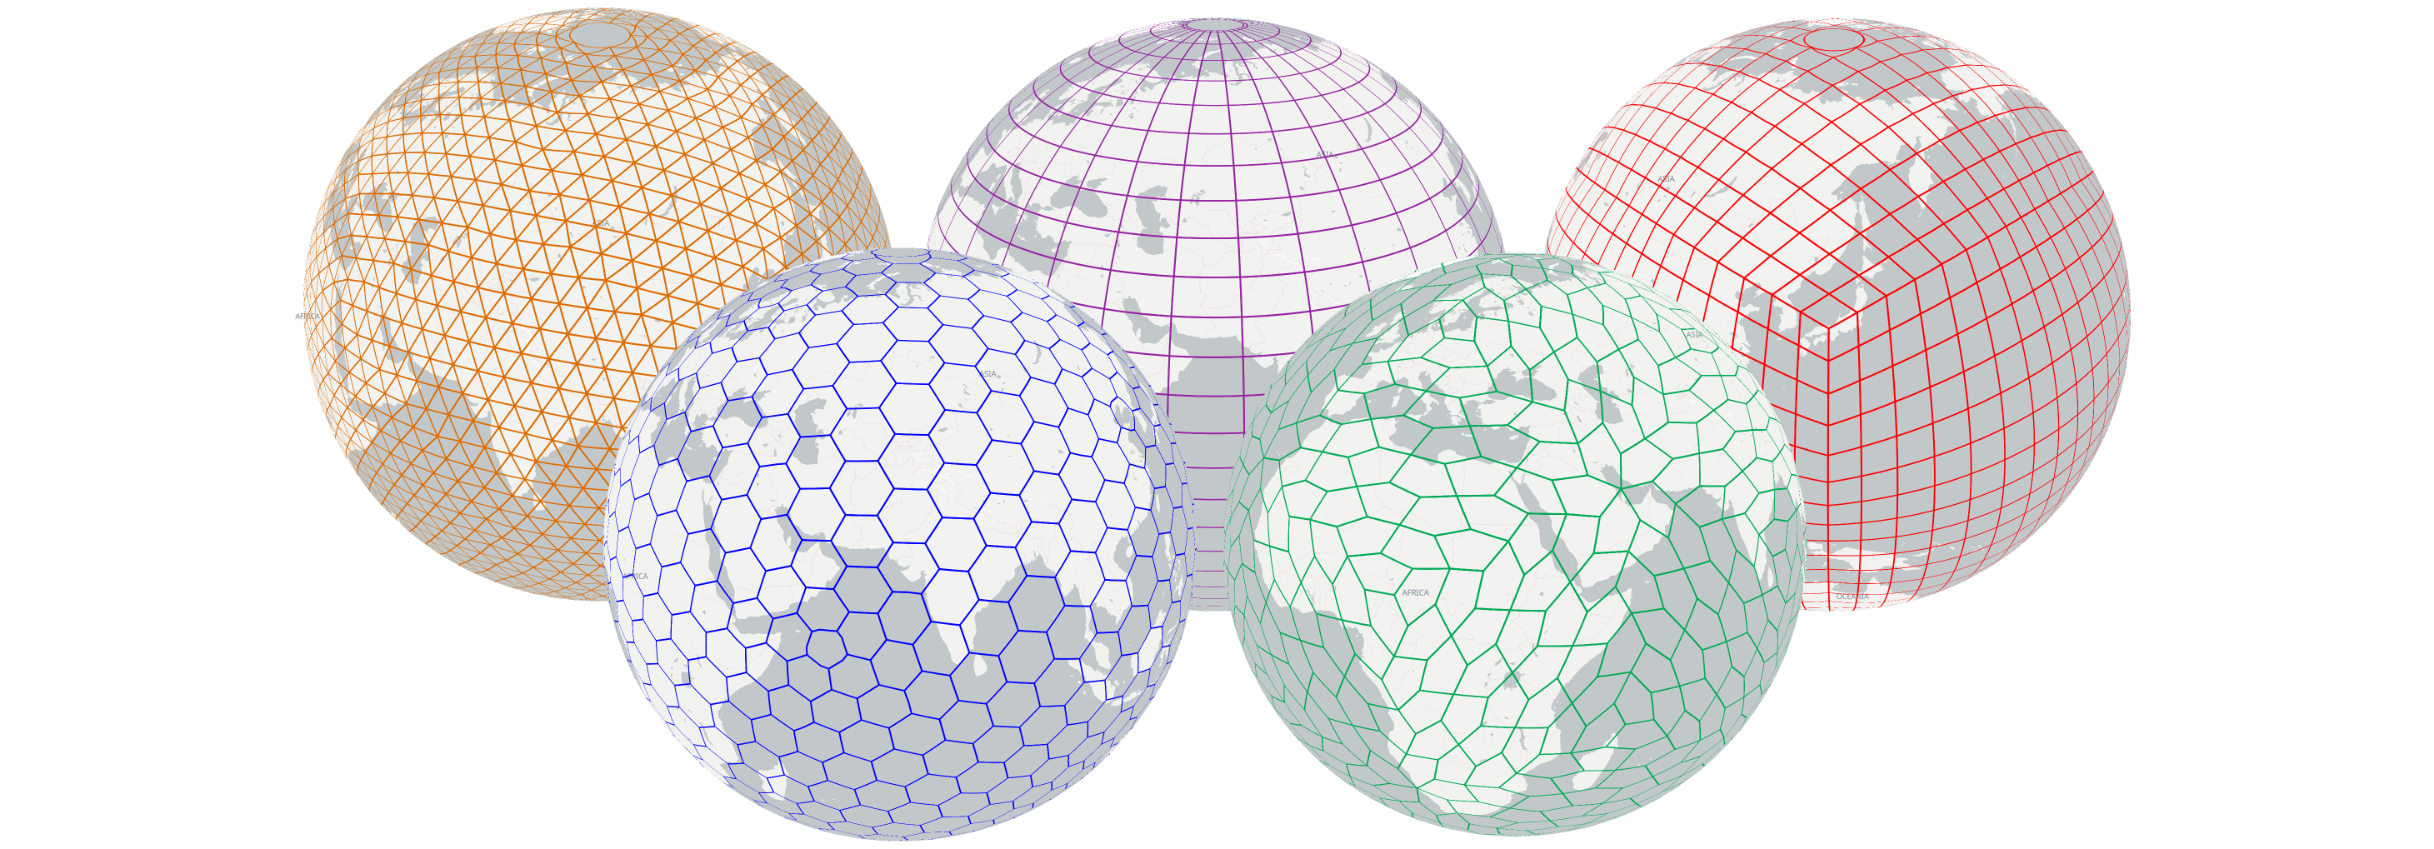
Vgrid supports a wide range of popular DGGSs, including H3, S2, A5, rHEALPix, DGGAL, DGGRID, Open-EAGGR ISEA4T, ISEA3H, EASE-DGGS, QTM, OLC, Geohash, GEOREF, MGRS, TileCode, Quadkey, Maidenhead and GARS.
Vgrid supports popular input and output GIS formats, including CSV, GeoJSON, Pandas/GeoPandas, Shapefile, GeoPackage, and GeoParquet.
Full Vgrid DGGS documentation is available at vgrid document.
To work with Vgrid DGGS directly in GeoPandas and Pandas, use the vgridpandas package. Full Vgridpandas DGGS documentation is available at vgridpandas document.
To work with Vgrid DGGS in QGIS, install the Vgrid Plugin.
To visualize DGGS in Maplibre GL JS, try the vgrid-maplibre library.
For an interactive demo, visit the Vgrid Homepage.
![]()
![]()

![]()
![]()
![]()
References:
- h3-py by Uber.
- s2sphere by Sidewalk Labs.
- a5-py by Felix Palmer and Thang Quach.
- rhealpixdggs-py by Manaaki Whenua – Landcare Research.
- open-eaggr by Riskaware.
- EASE-DGGS by GEMS-UMN.
- pydggal by Jerome St-Louis from Ecere.
- DGGRID by Kevin Sahr.
- dggrid4py by Alex Kmoch.
- QTM by Thang Quach, with reference to QTM by Paulo Raposo.
- Lat Lon Tools QGIS Plugin by Calvin Hamilton.
- gars-field by Corteva Agriscience.
- Tilecode & Quadkey by Thang Quach, utilizing mercantile by Mapbox.
- antimeridian by gadomski.
- The DGGS Inspect feature in Vgrid is inspired by Area and shape distortions in open-source discrete global grid systems by Alex Kmoch et al. (2022) (resources).
- The Vgrid Document is inspired by leafmap developed by Qiusheng Wu from Open Geospatial Solutions.
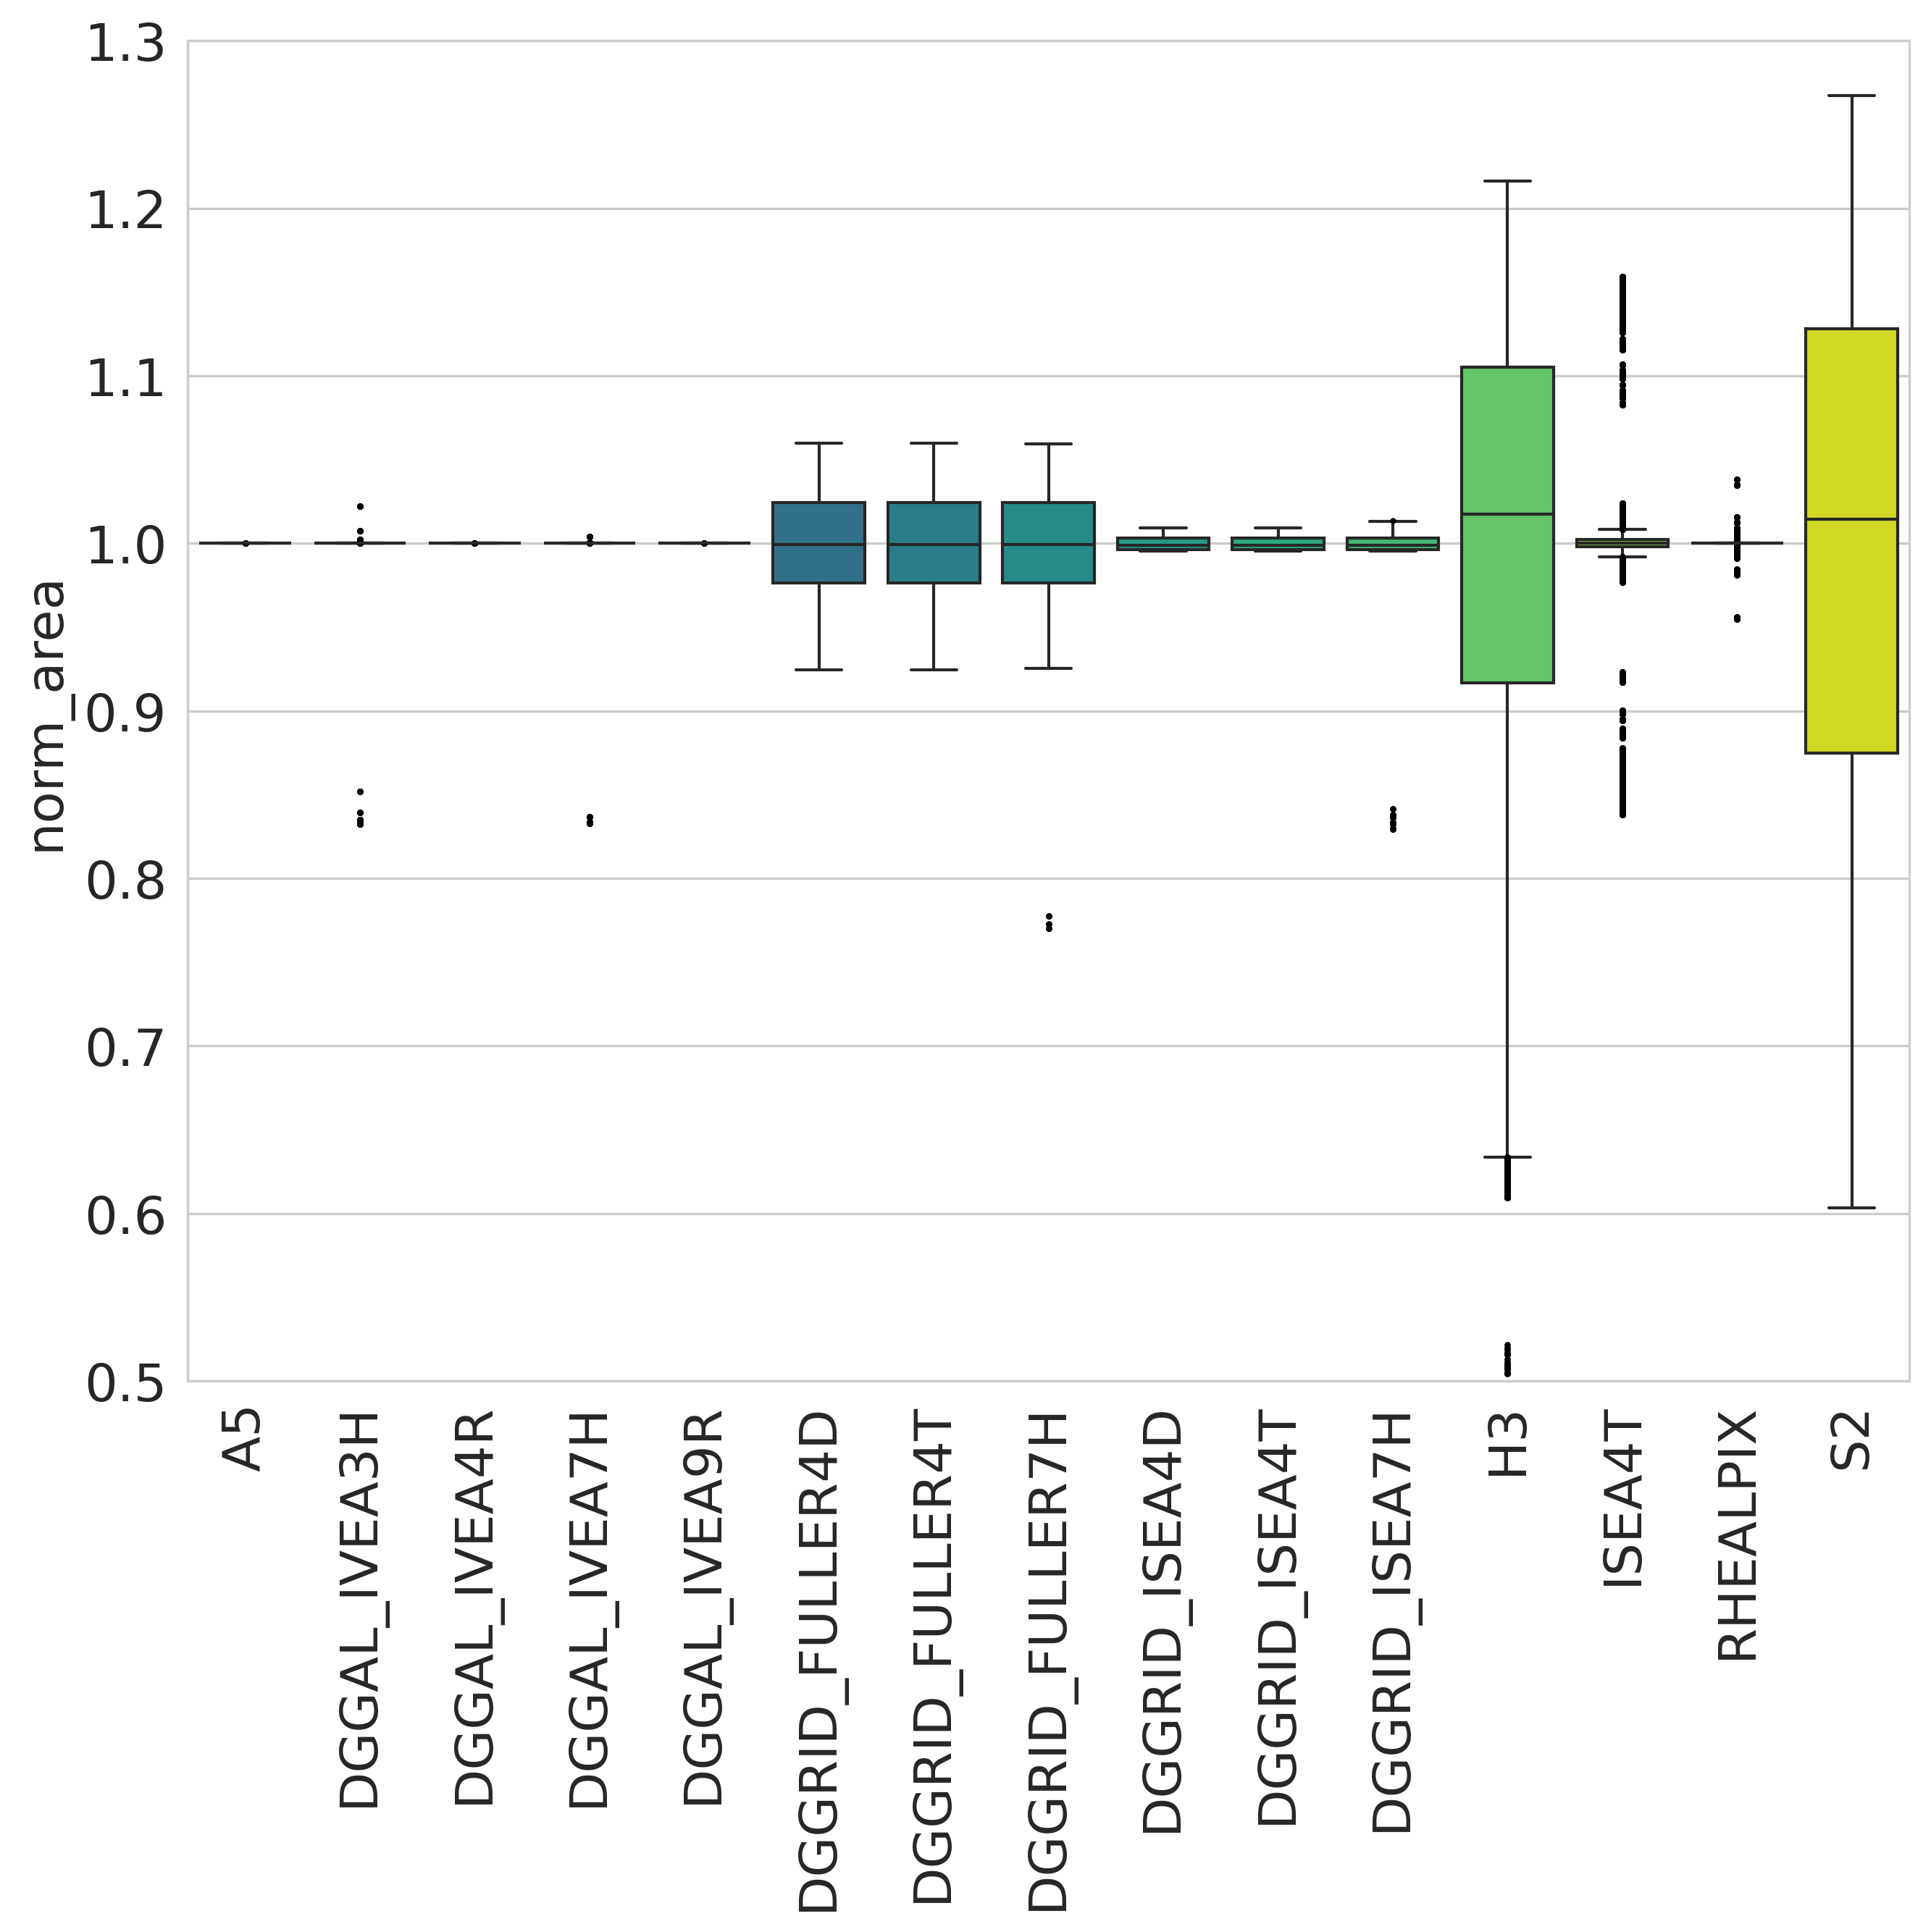
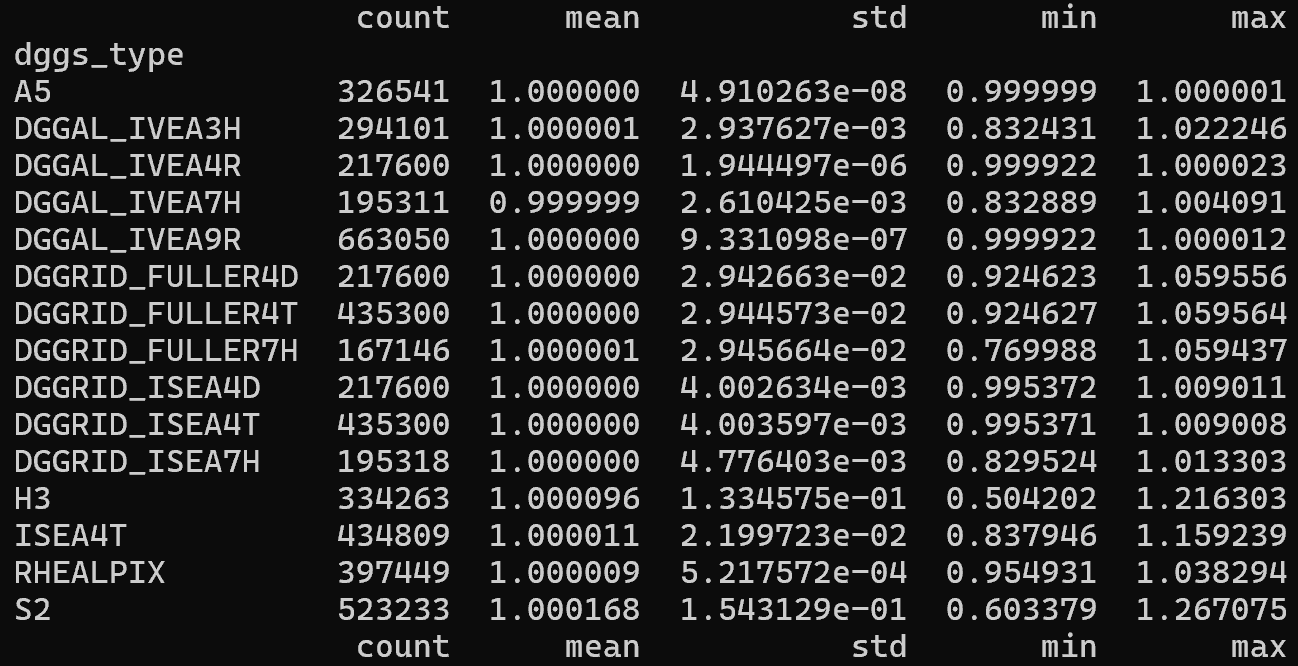
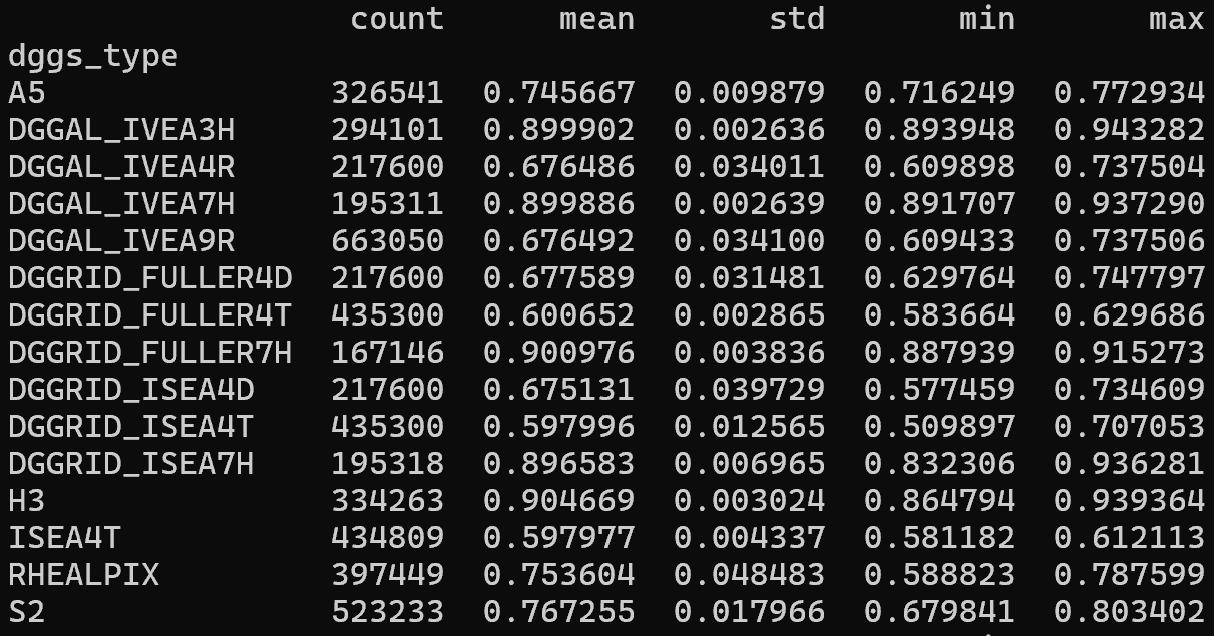
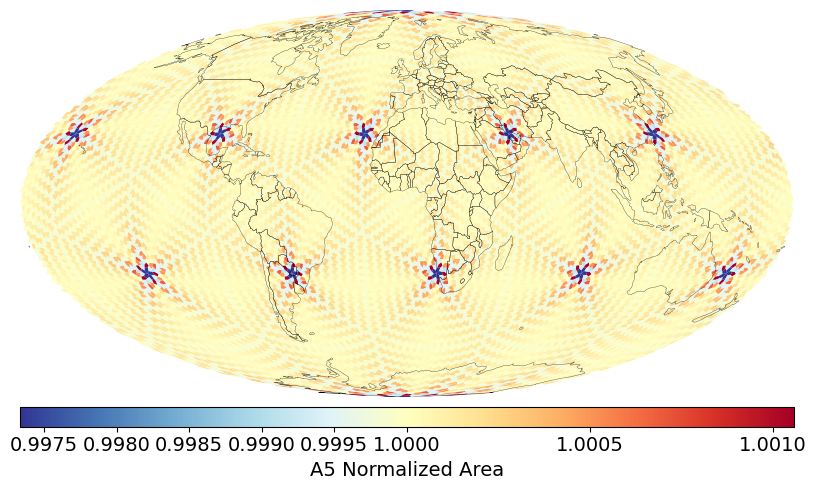
Area distortion over normalized areas of popular geodesic DGGS
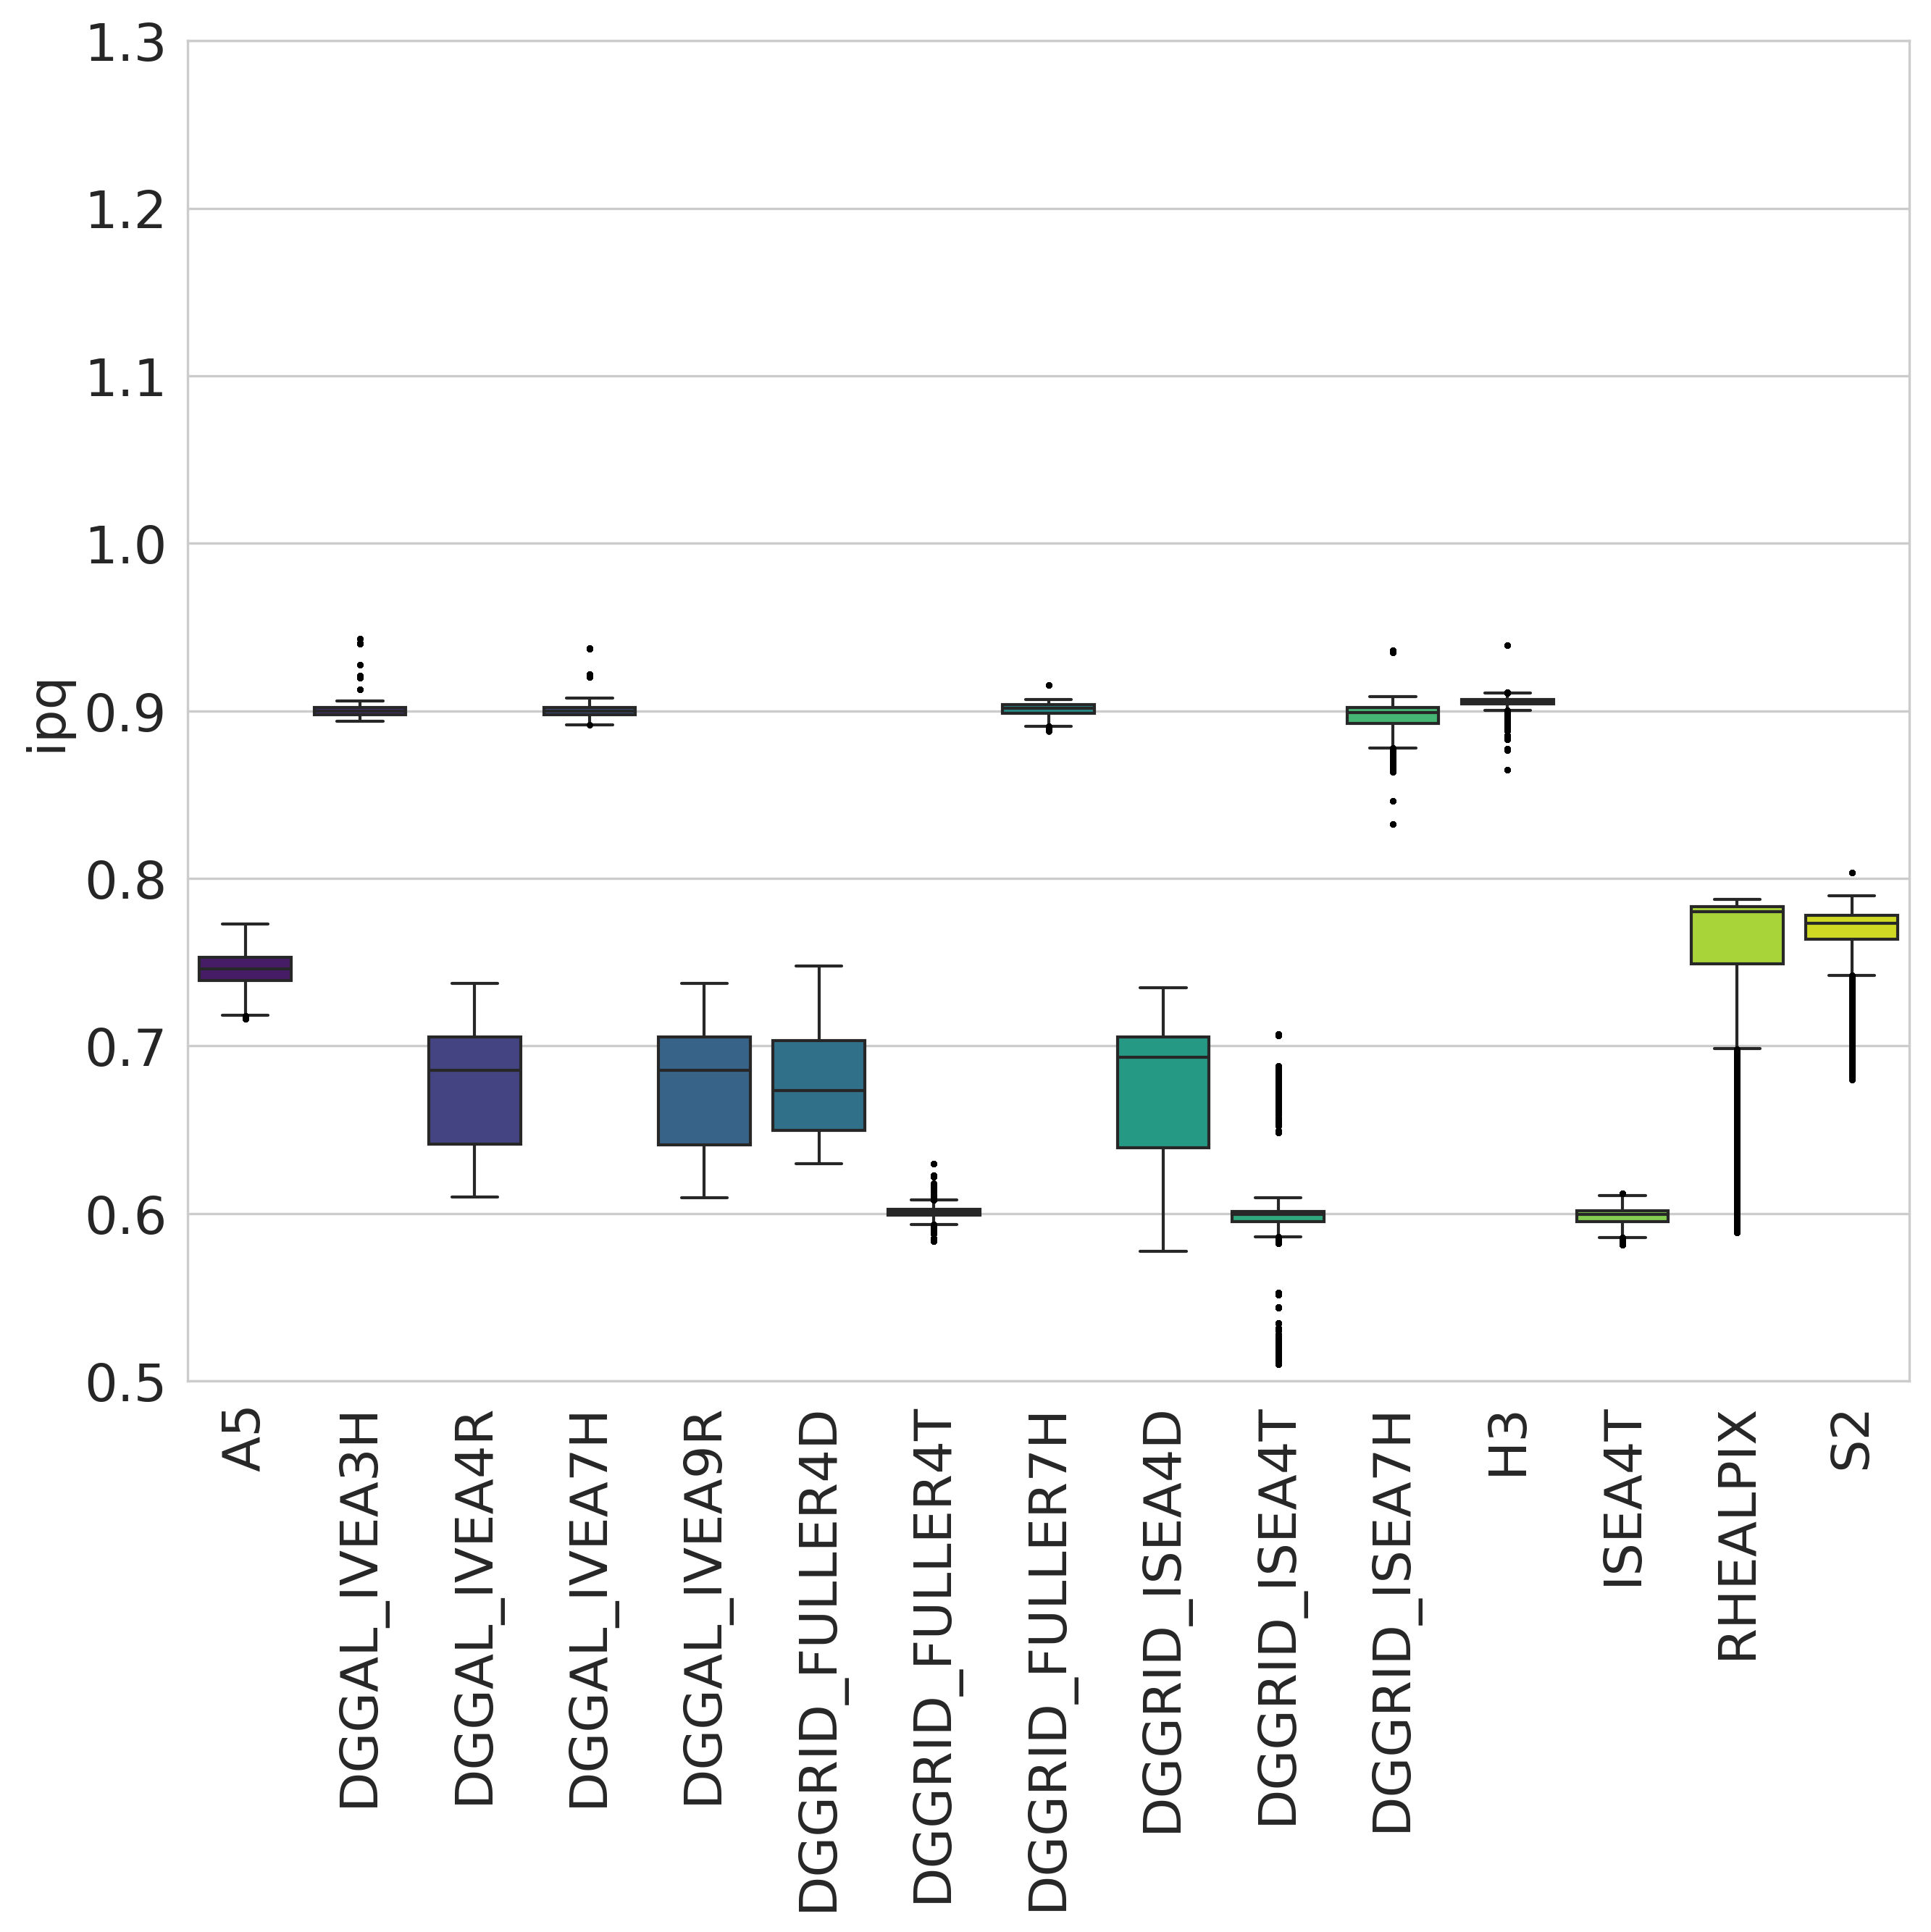
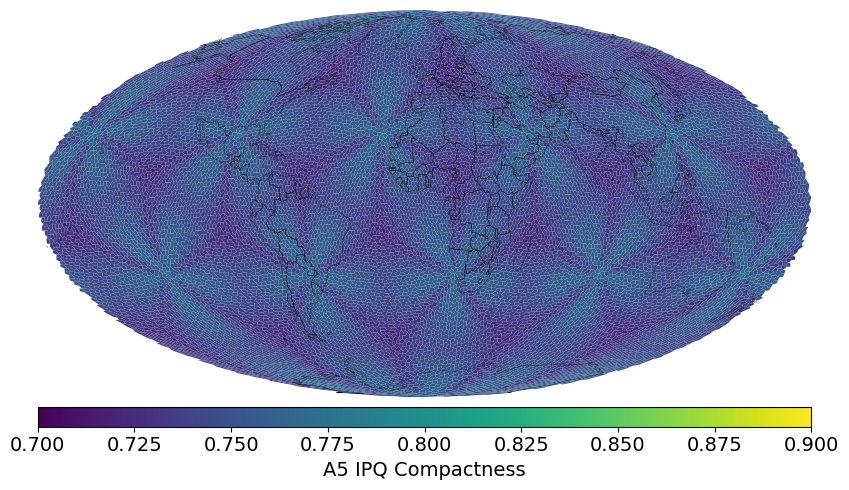
IPQ compactness distribution over popular geodesic DGGS
Isoperimetric Inequality (IPQ) Compactness (suggested by Osserman, 1978):
The range of the IPQ compactness metric is [0,1].
A circle represents the maximum compactness with a value of 1.
As shapes become more irregular or elongated, their compactness decreases toward 0.
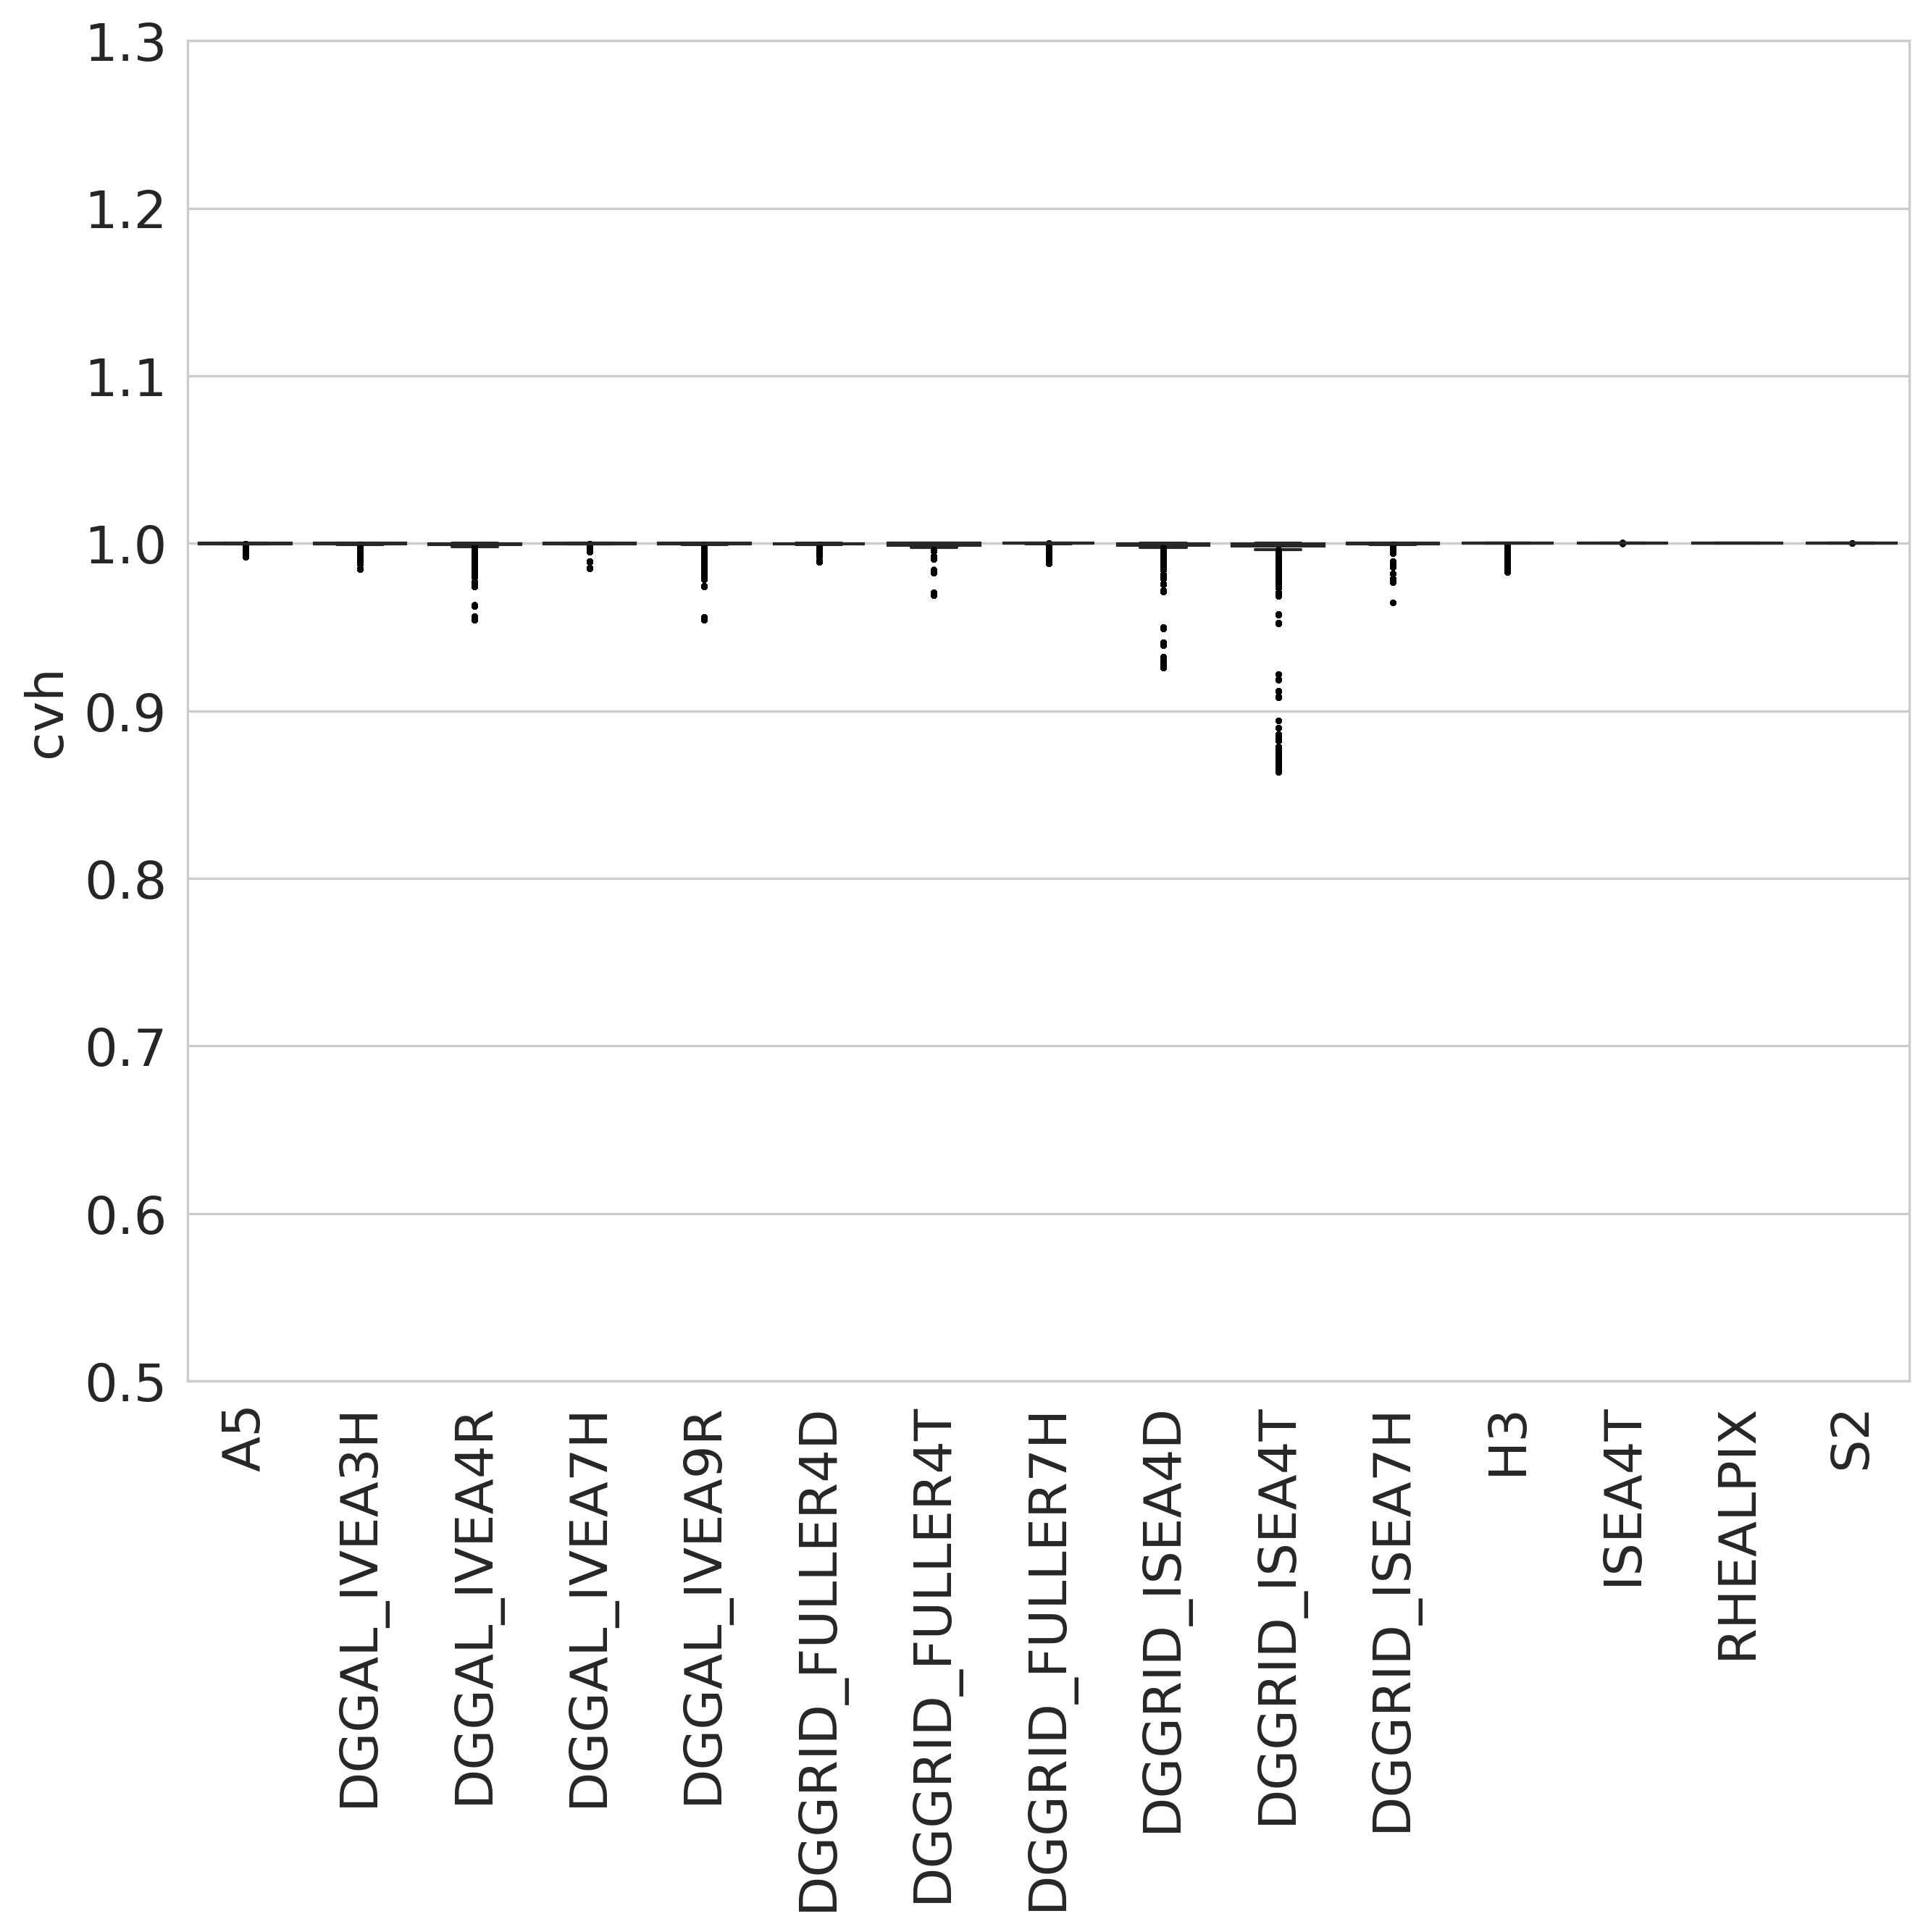
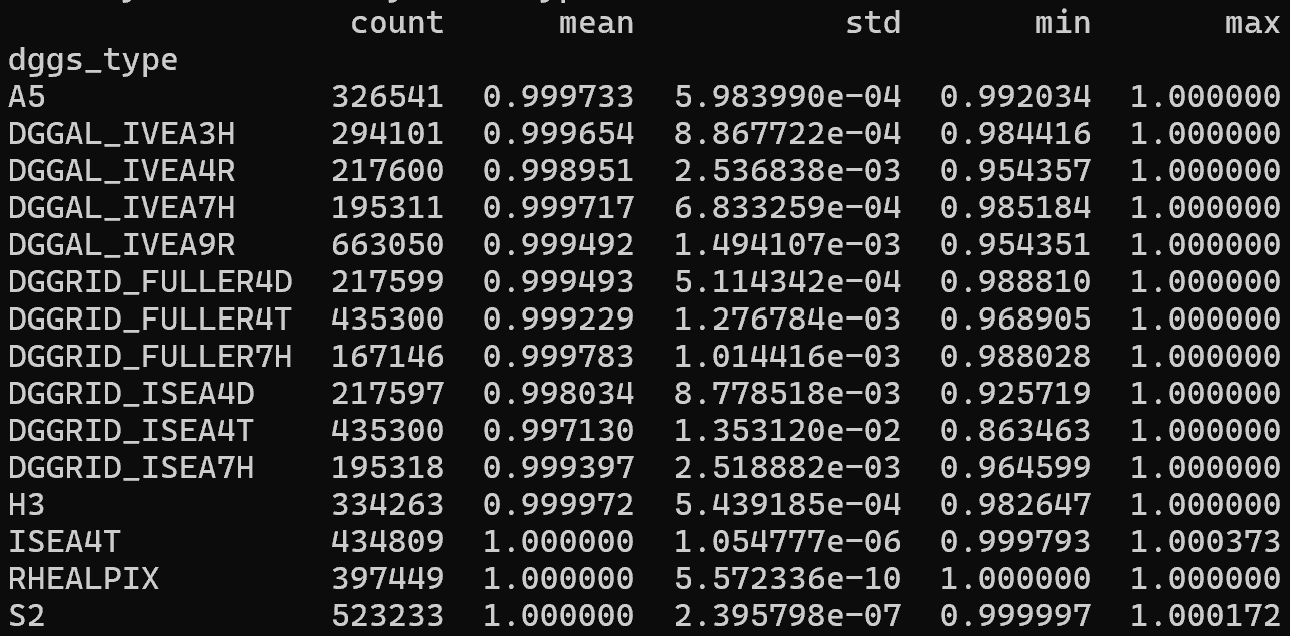
Convex hull compactness distribution over popular geodesic DGGS
The range of the convex hull compactness metric is [0,1].
As shapes become more concave, their convex hull compactness decreases toward 0.
Installation
pip

1 | |
Key Features
-
DGGS Conversion: Convert Latlon to DGGS, DGGS cells to Shapely Geometry/ GeoJSON, Vector to DGGS, Raster to DGGS.
-
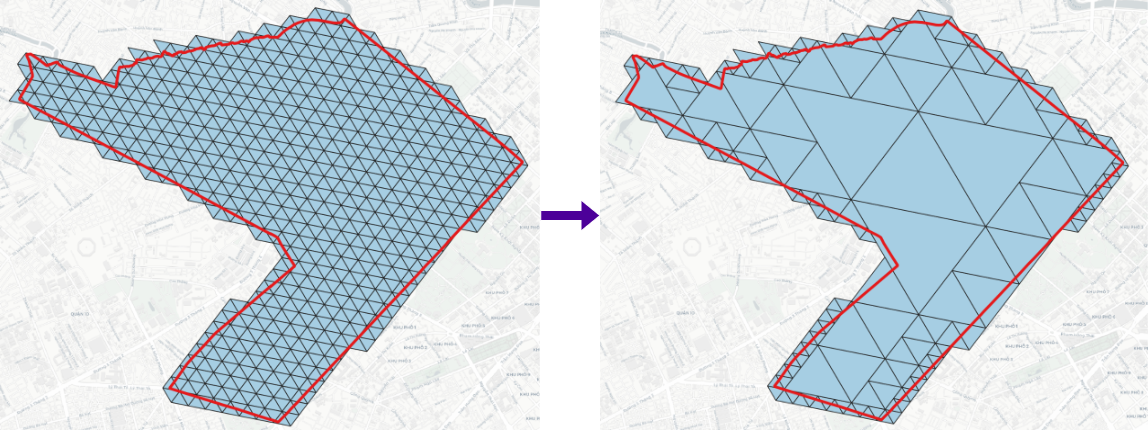
DGGS Compact: Compact DGGS cells or expand them to a specific resolution.
-
DGGS Resample: Resample a source DGGS layer to another DGGS type or resolution, with optional area-weighted or nearest-neighbour attribute transfer.
-
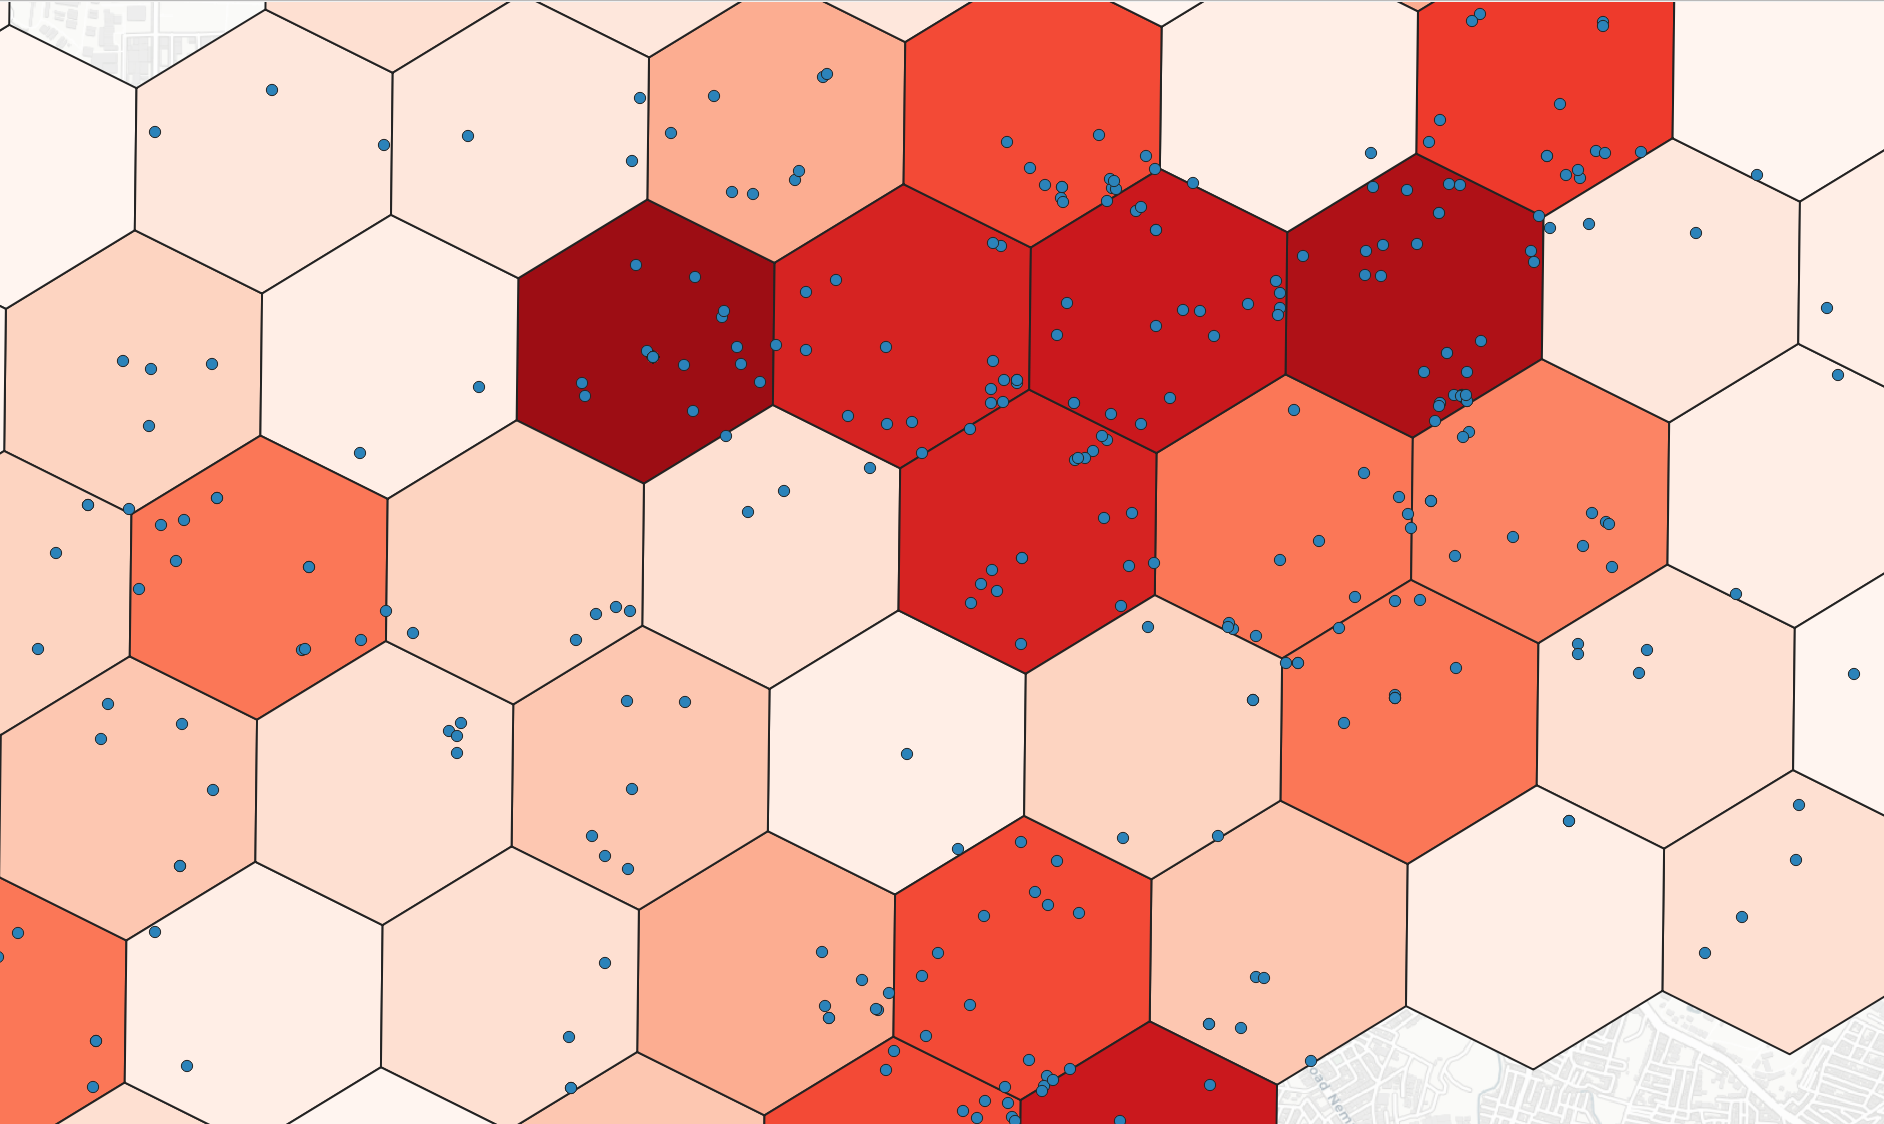
DGGS Binning: Aggregate points into DGGS cells, supporting common statistics (count, min, max, etc.) and category-based groups.
-
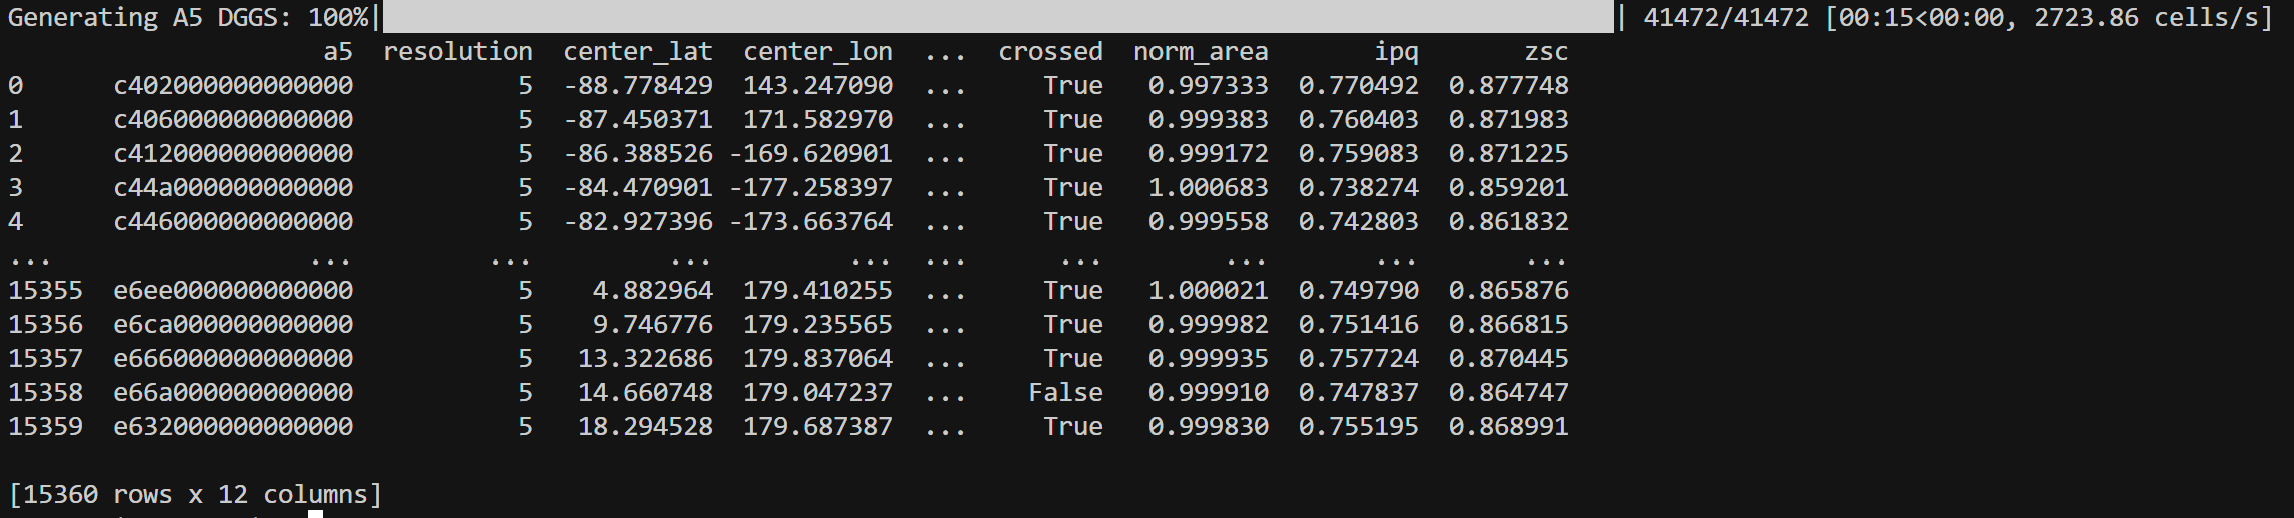
DGGS Generator: Generate DGGS at a specfic bounding box and resolution.
-
DGGS Inspect: Calculate and visualize DGGS area distortions and IPQ (isoperimetric inequality) compactness at a specific resolution.
-
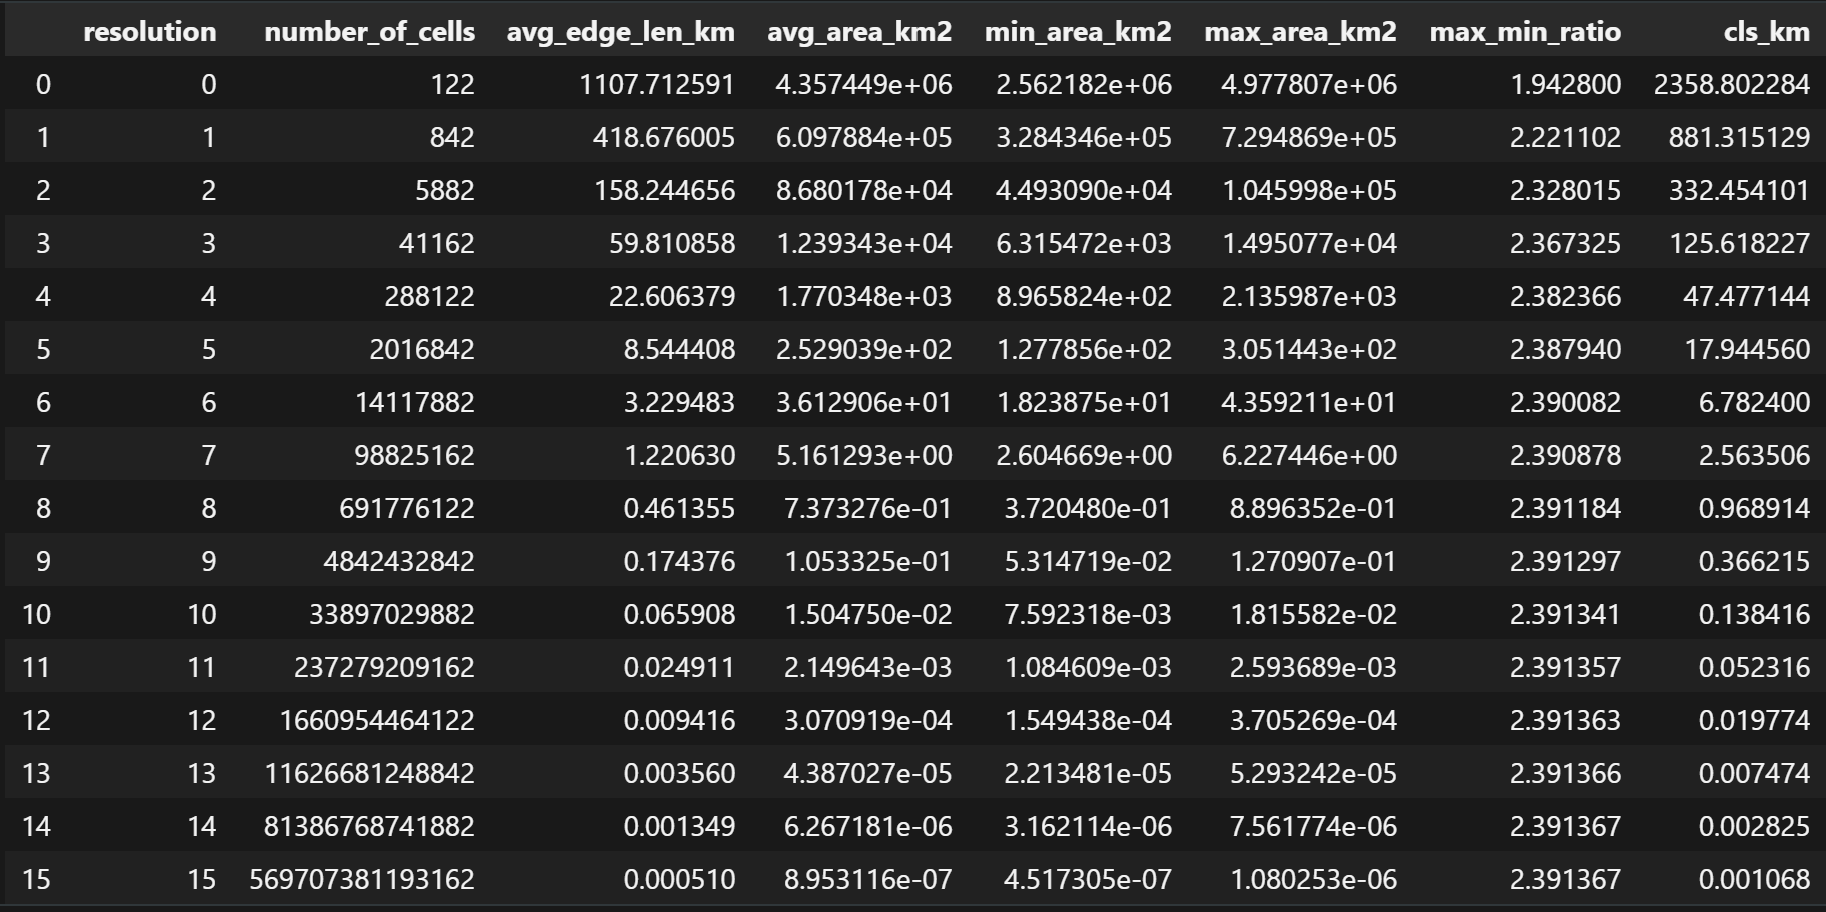
DGGS Stats: Show DGGS metrics for each resolution like number of cells, average edge length, average cell area, perimeter.
Usage examples
Latlon to DGGS
1 2 3 4 5 6 7 8 | |
DGGS to Shapely Polygon
1 2 3 4 5 6 | |
DGGS to GeoJSON
1 2 3 4 5 | |
Vector to DGGS
1 2 3 4 | |
DGGS Compact
1 2 3 | |
DGGS Expand
1 2 3 | |
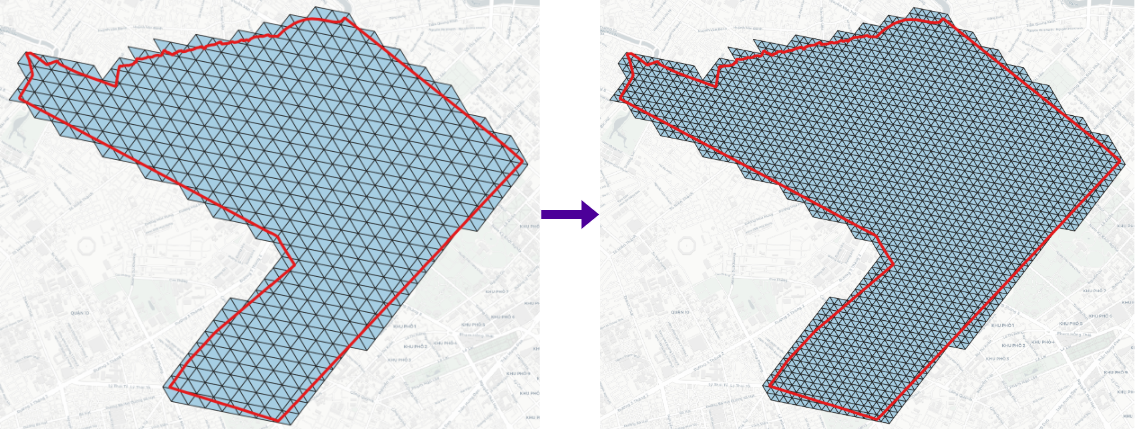
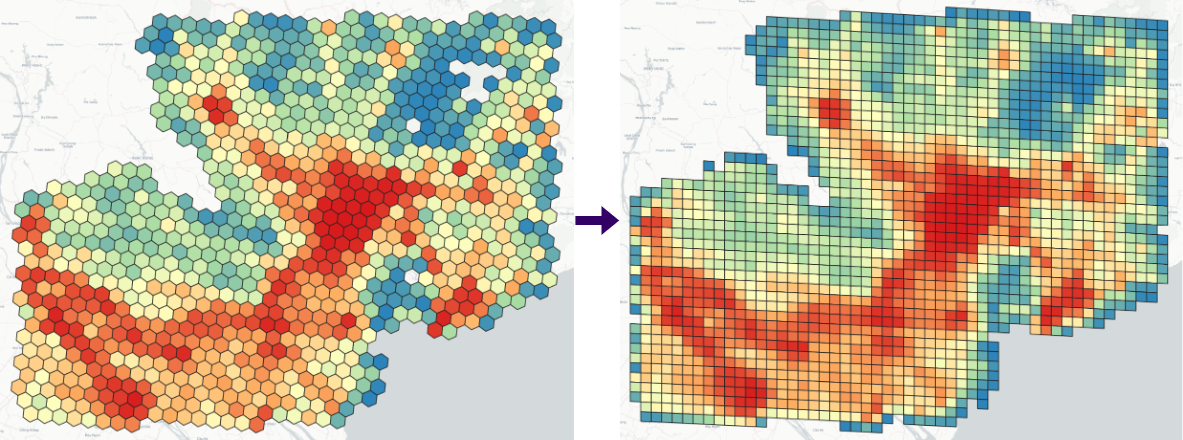
DGGS Resample
Resample a source DGGS layer to another DGGS type (or resolution): build a target grid over the source footprint, then optionally transfer a numeric attribute by area-weighted overlap (default) or nearest-neighbour assignment from source cells. Omit resolution or pass -1 to pick the target resolution that best matches mean source cell area.
1 2 3 4 5 6 7 8 9 10 11 12 13 | |
DGGS Binning
1 2 3 4 5 6 7 | |
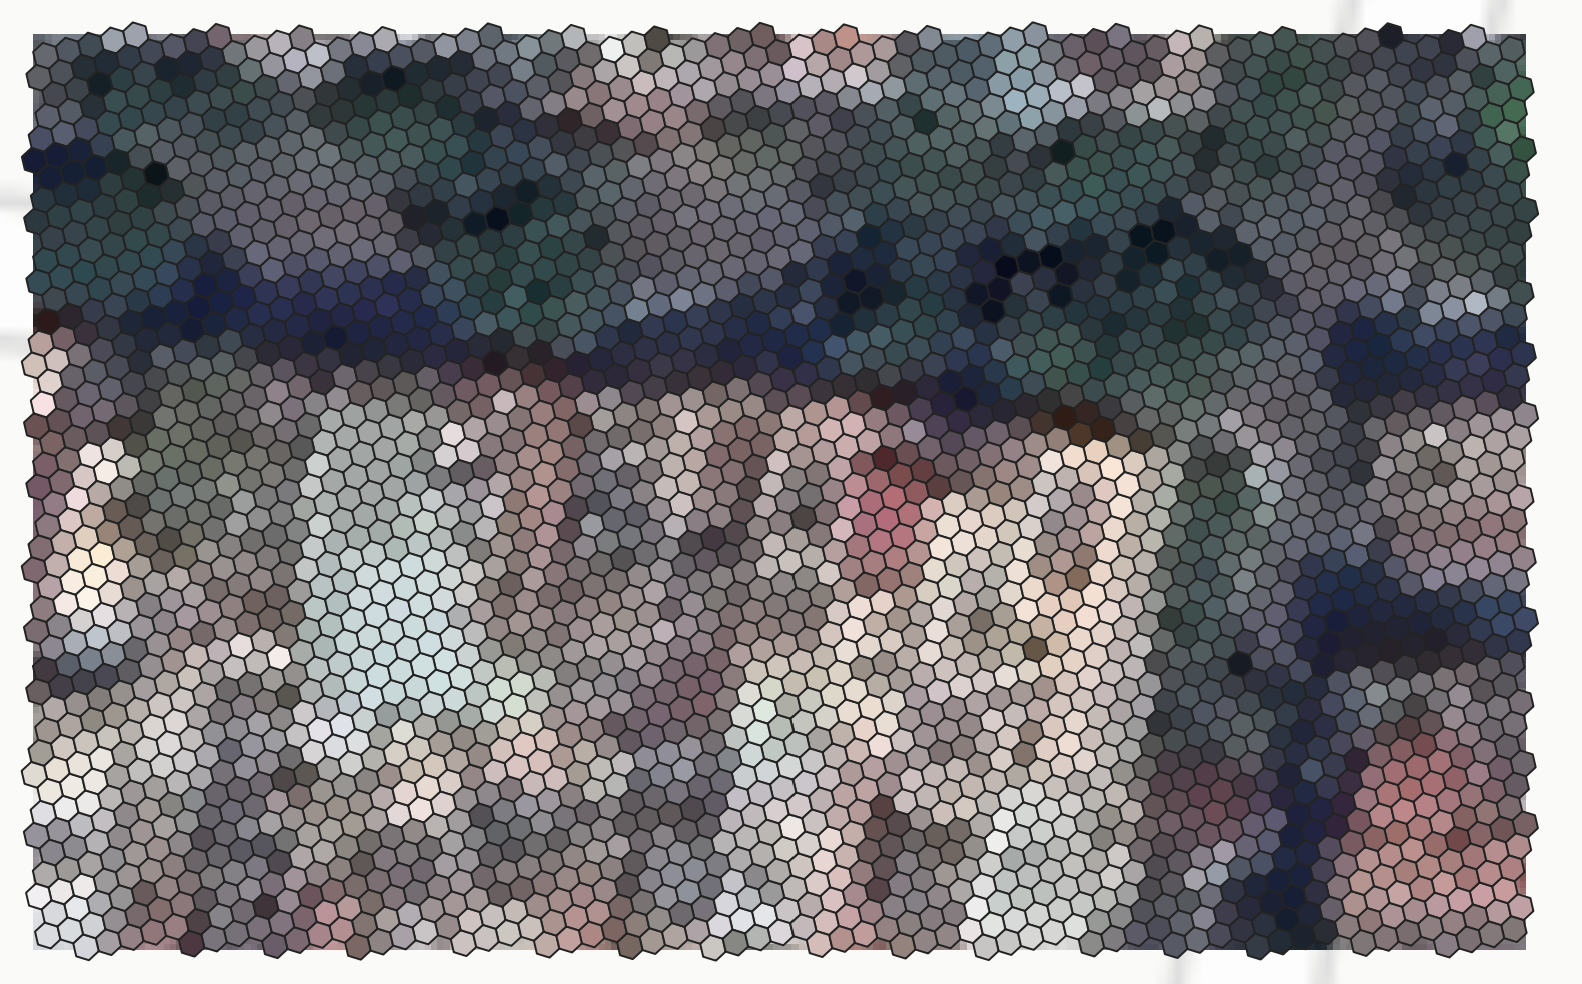
Raster to DGGS
1 2 3 4 5 6 | |
DGGS Generator
1 2 3 | |
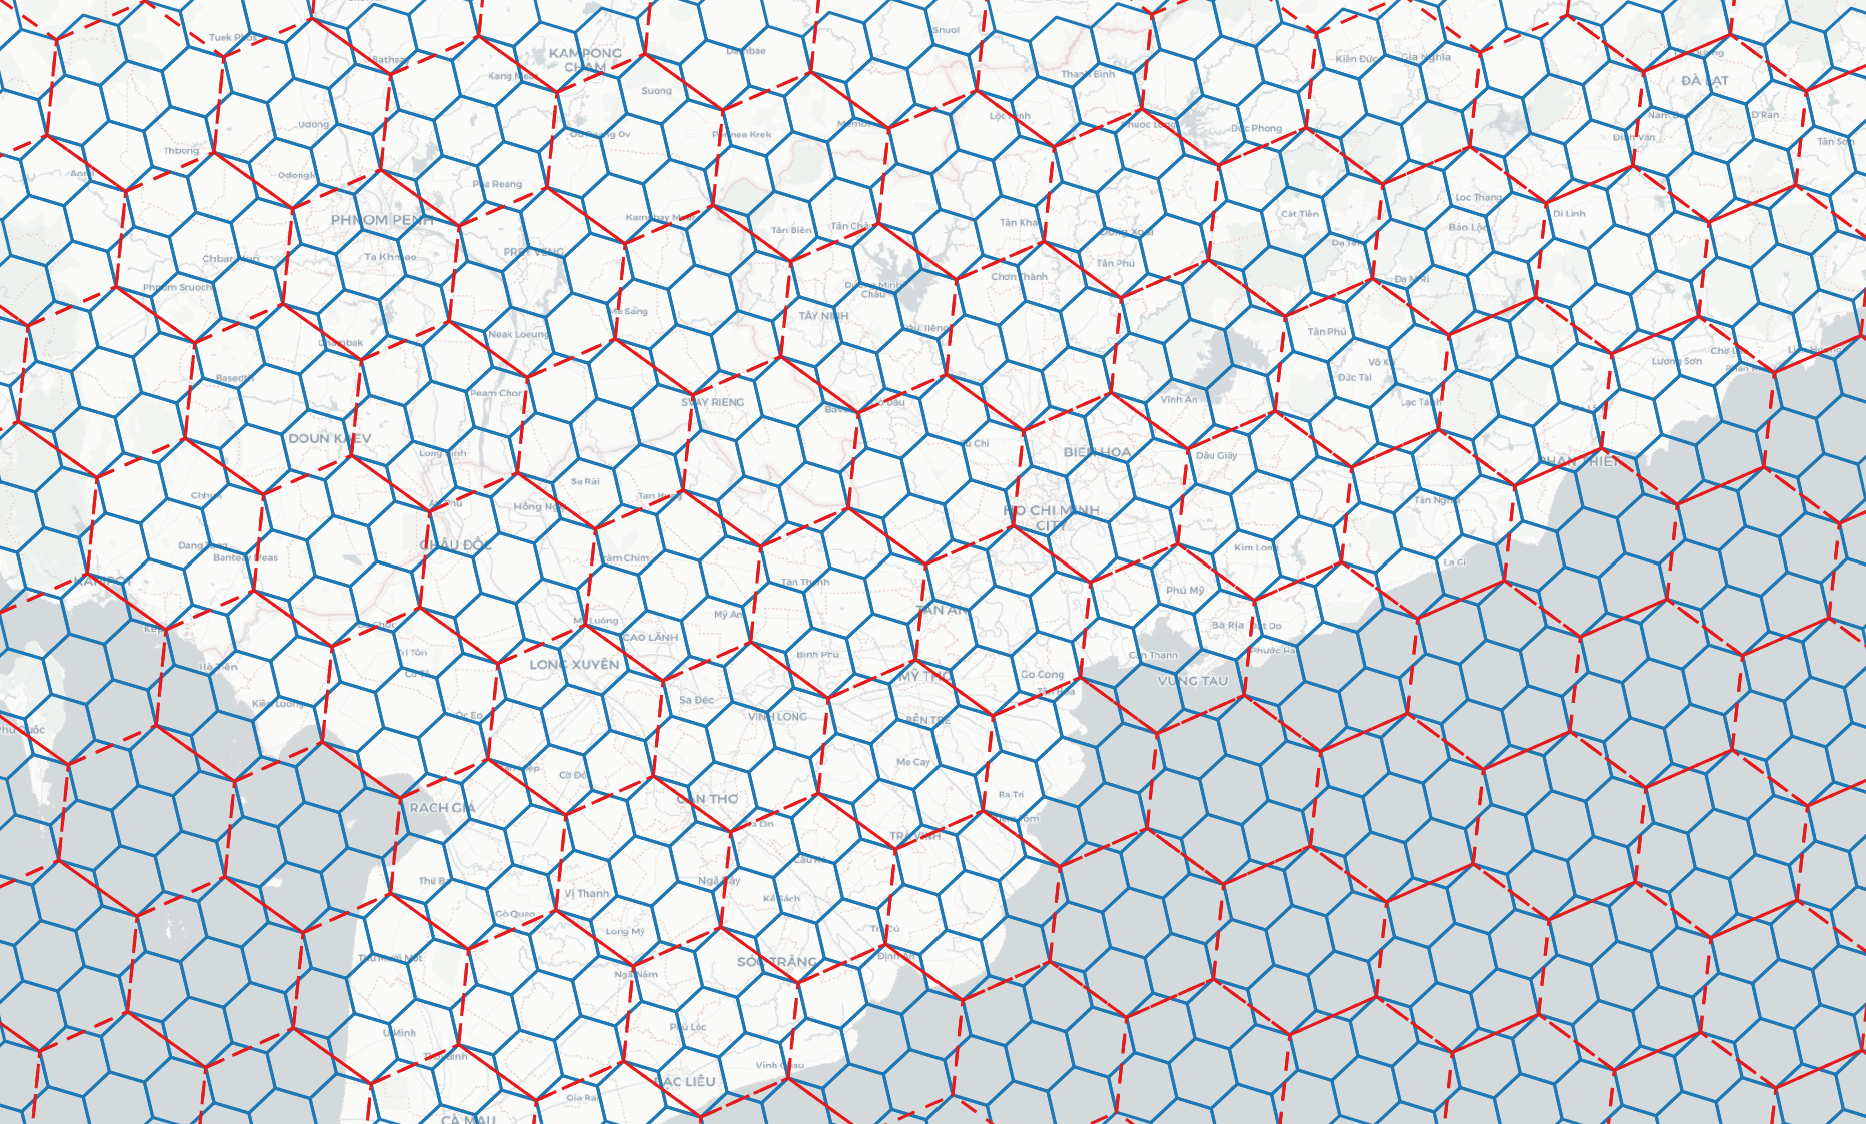
DGGS Inspect
1 2 | |
Distribution of DGGS Area Distortions visualized from DGGS Inspect
Visualization of DGGS IPQ Compactness visualized from DGGS Inspect
DGGS Stats
1 2 | |
Further examples
For more examples, see the example notebooks.